


Free Samples Available
Qualified projects can receive free product samples
Qualified projects can receive free product samples
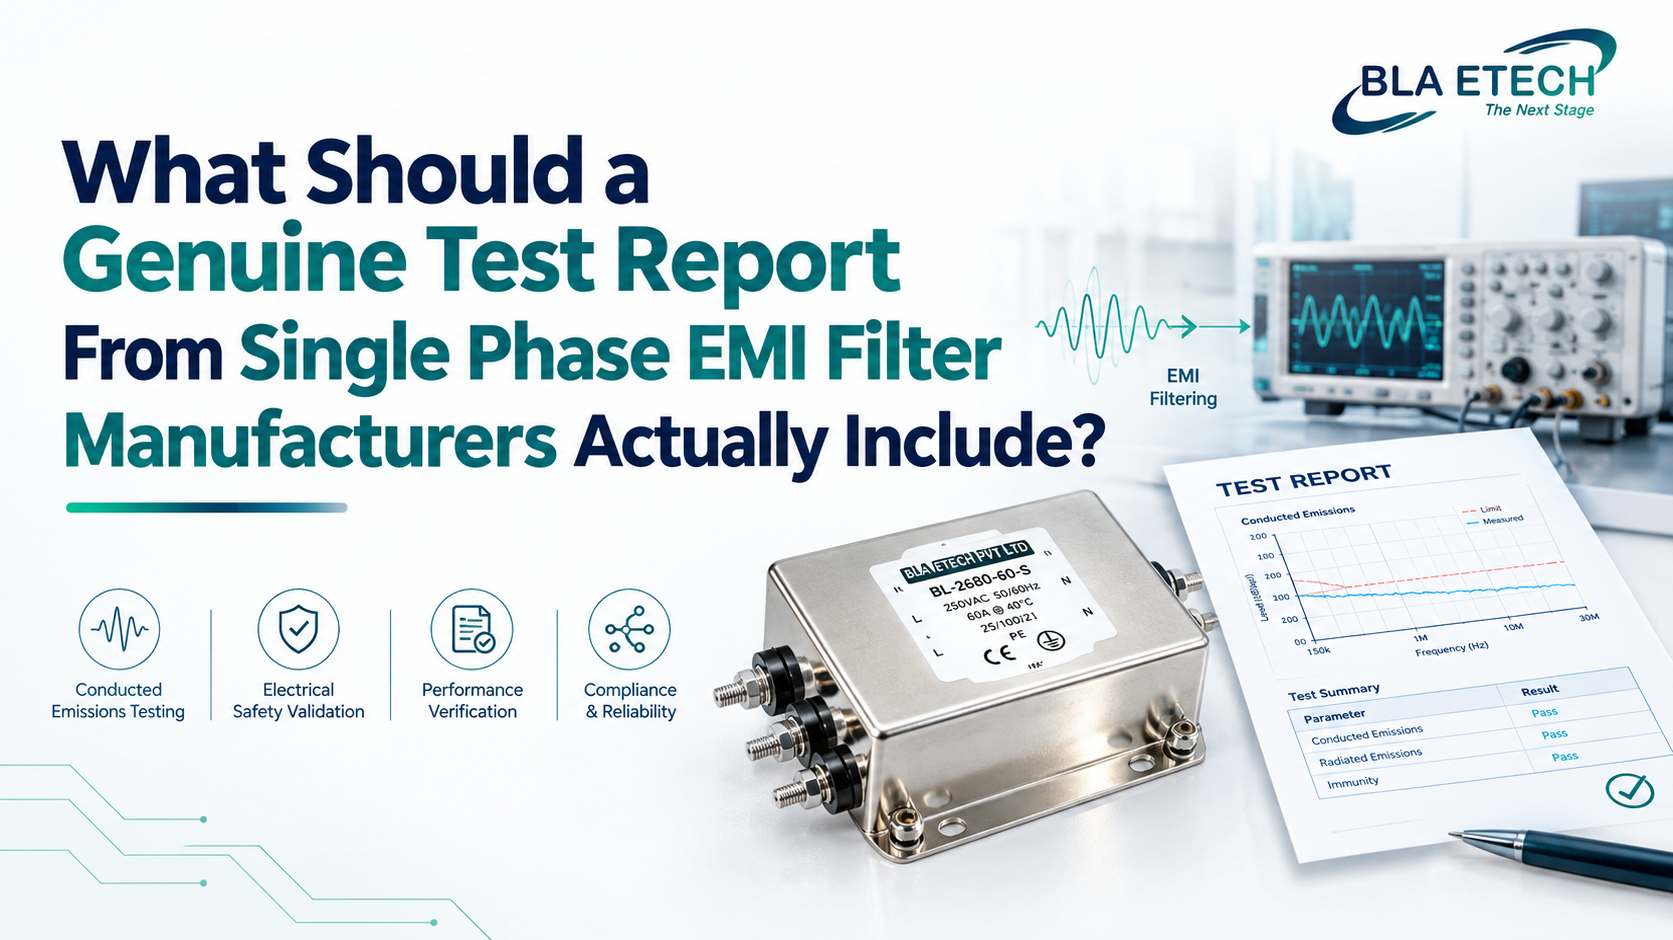
Ask any EMI filter manufacturer for test data and you will usually get something back: a PDF with a smooth attenuation curve, a few ratings, and a logo. Whether that document deserves a place in your design file is a different question. A curve with no test conditions behind it is a marketing graphic, not evidence. For buyers comparing an EMI filter company on technical merit, knowing what a real test report contains is one of the most useful skills in the sourcing process.
This guide walks through what a genuine report should show, where reports quietly leave things out, and a short checklist you can apply to any single phase EMI filter before it reaches your bill of materials.
A datasheet curve answers one narrow question: how much noise does this filter remove under one specific setup? A test report answers a broader one: how was that number produced, on which sample, under which conditions, and does the part also stay safe and within its ratings? The difference matters because an EMI filter can look excellent on one curve and still fail in your equipment, or fail a safety audit, because nobody tested the things the curve does not show.
Insertion loss is the headline number, and it is calculated from a simple ratio: 20 times the log of the voltage across the load before the filter is inserted divided by the voltage after. In practical terms, 20 dB means noise voltage drops to one tenth, and 40 dB means it drops to one hundredth.
What gets overlooked is the test impedance. Most published curves use a 50 ohm source and 50 ohm load because the equipment is common and the setup is easy. CISPR 17, the standard covering how passive EMI filters are measured, also defines an approximate worst case method using 0.1 ohm and 100 ohm terminations. Real power lines almost never present 50 ohms, so the two methods can give very different answers.
The gap can be large. One published analysis showed that a filter quoted at 50 dB at 100 MHz in a 50-ohm system could land anywhere from roughly 33 dB to 60 dB depending on the filter circuit and the actual source and load impedances. A genuine report states which impedance setup was used, and a strong one shows both.
CISPR 17 defines separate measurements for differential mode (symmetrical) and common mode (asymmetrical) noise. A report that shows a single unlabeled curve leaves you guessing which noise path it describes. Common mode noise tends to dominate as frequency rises, so the common mode curve is often the one that decides whether your product passes. Look for both curves, clearly labeled, across the full frequency range your equipment needs, typically from 150 kHz upward.
Attenuation is only half of what a report should cover. A filter sits directly on the mains, so a credible report should also document:
Leakage current: measured at rated voltage and frequency, because the capacitors that make the filter work also create a path to ground. Limits depend on the end application, which is why this number matters more for some equipment than others.
Dielectric withstand (hipot) test: the voltage applied between line and ground, its duration, and the pass criteria.
DC resistance: which affects voltage drop and heating at rated current.
Temperature rises at rated current: with the ambient temperature recorded, since a current rating without an ambient reference is incomplete.
Rated voltage and current: stated plainly and consistent with the part number.
A report that covers only insertion loss and skips these has told you how the filter performs, but not whether it is safe or properly rated.
A number you cannot reproduce is a number you cannot rely on. Genuine reports record the part number and sample details, the test date, the standard or method followed, the equipment used, and the ambient conditions. They also state pass and fail criteria in advance, not after the fact. If a report is missing these, the data may be real, but you have no way to confirm it.
Does it name the standard or method used, such as CISPR 17?
Does it state the source and load impedance for every curve?
Are differential mode and common mode shown separately?
Does it cover the full frequency range your design needs?
Are leakage current, hipot, DC resistance, and temperature rise included?
Is the part number, test date, and ambient condition recorded?
Can the manufacturer supply data for the exact part you are ordering, not a similar one?
A supplier's willingness to share complete test data is often as telling as the data itself. A manufacturer confident in its parts will usually provide full conditions without being pressed, and will explain any gap between a datasheet figure and a worst-case result. Reluctance, vague answers, or reports that look identical across different part numbers are worth noting.
BLA Etech holds ISO 9001, UL, CSA, and NEMKO certifications, which means its manufacturing process has been through a third party audit. Certifications do not replace test data, though, so the practical step is to ask for the report behind any specific part, including catalog filters such as BLA Etech's BL2010-01-F single phase part, and measure it against the checklist above.
A genuine test report tells you how an EMI filter was measured, under what conditions, and whether it is safe and correctly rated, not just how good one curve looks. Before accepting any report, check the impedance setup, the noise mode, the safety tests, and the recorded conditions.
If you are evaluating a filter for a new design, request the full report early and compare it to your own noise problem. BLA Etech's engineering team can walk through the data with you, and for applications outside the standard catalog, BLA Etech also builds custom EMI filters designed around your actual requirements.


